Bode Plot Semi-Log Paper
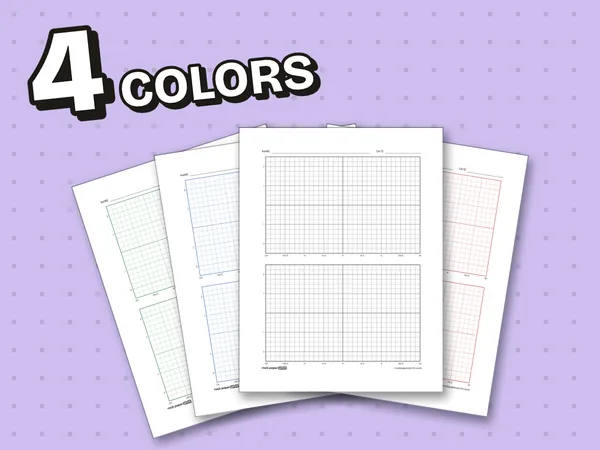
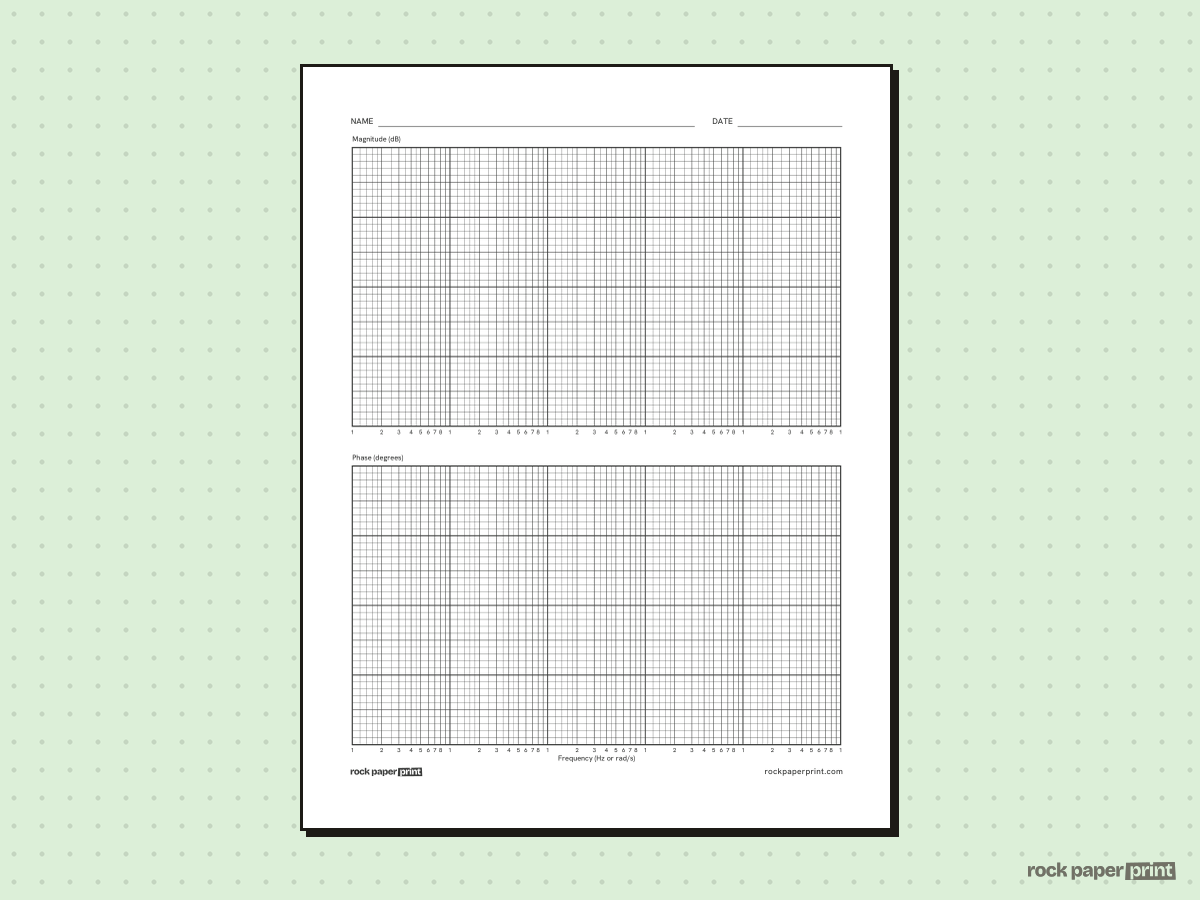
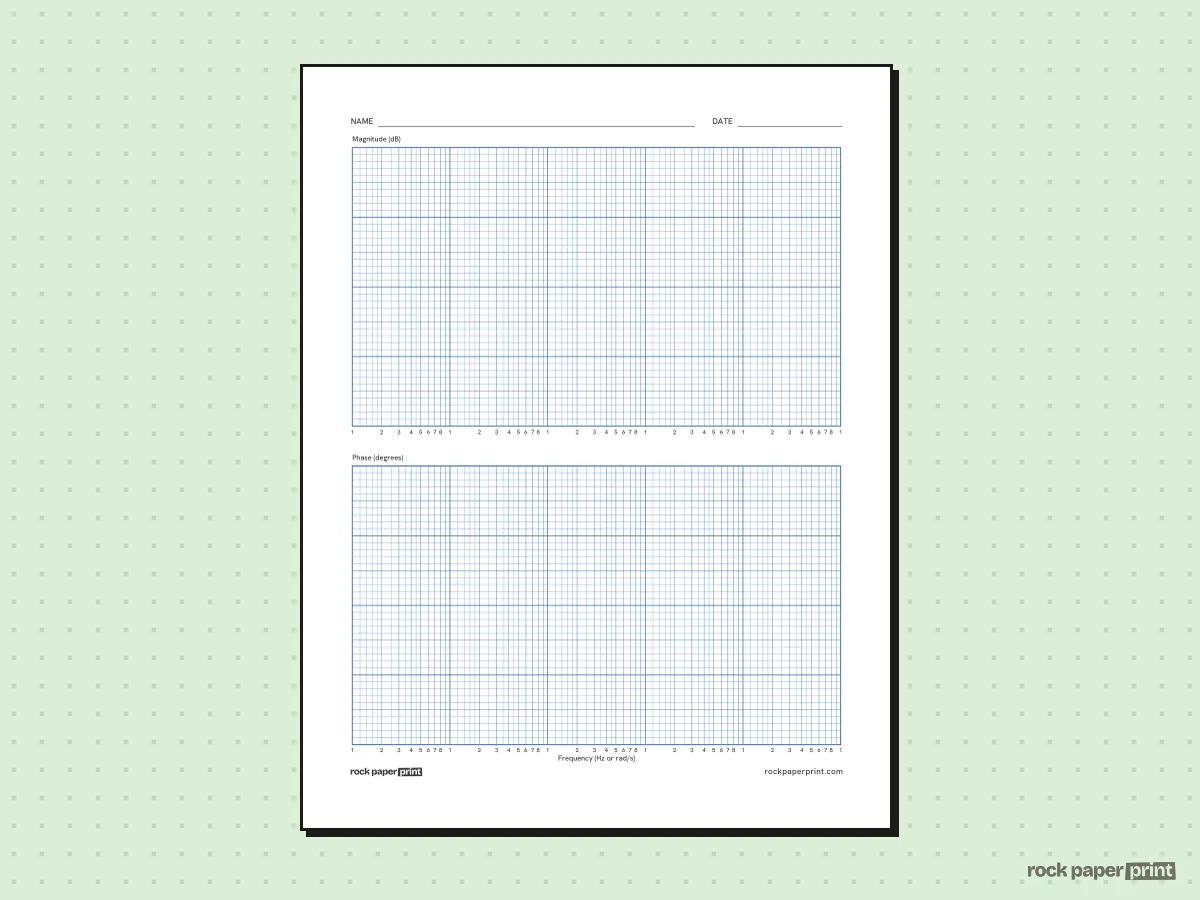
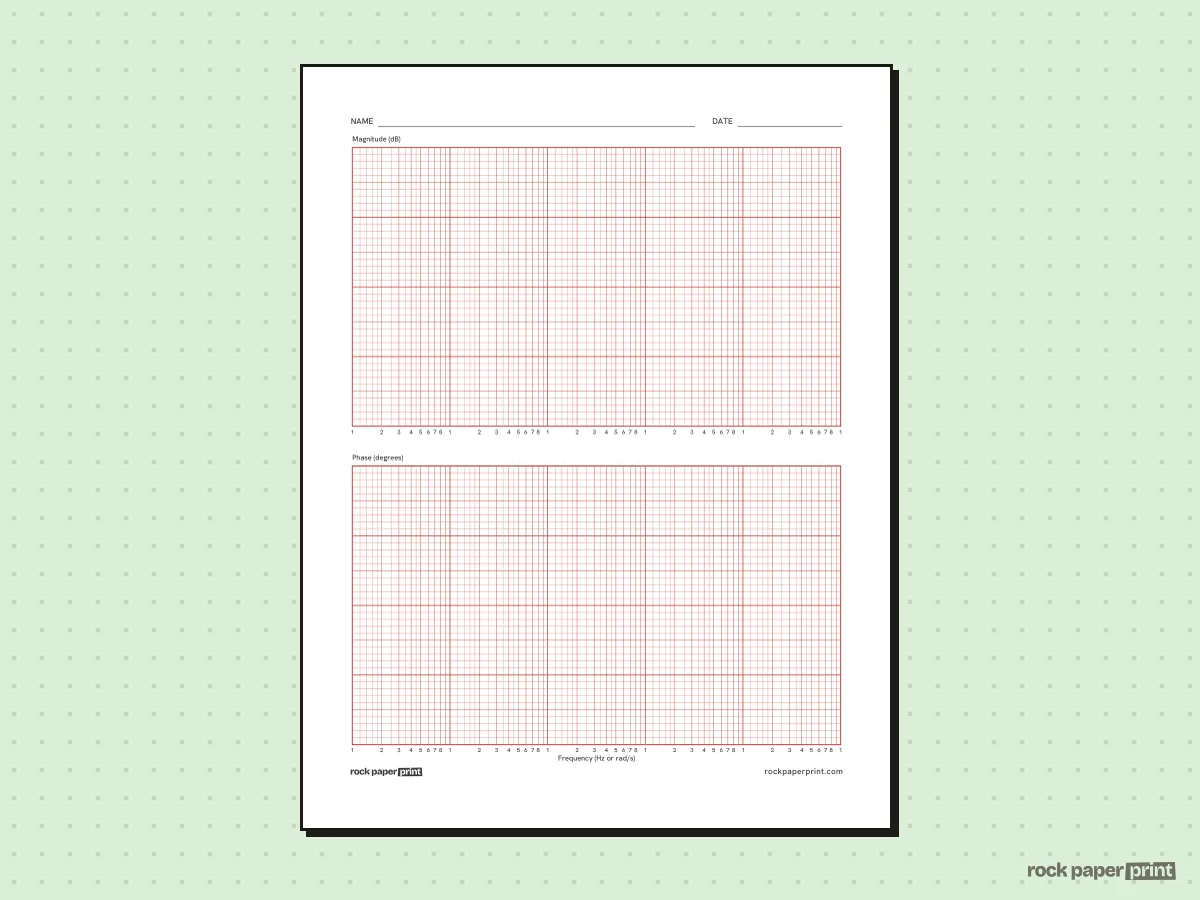
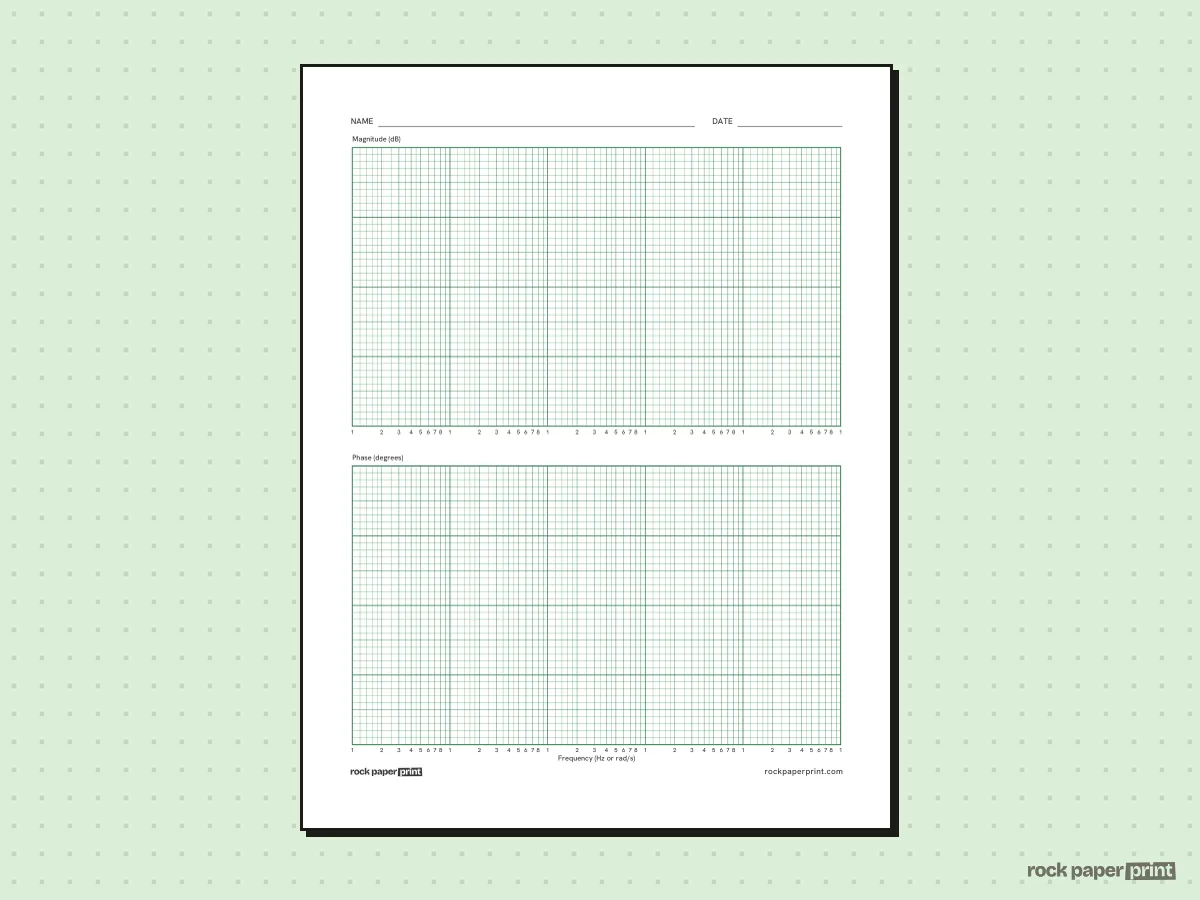
Pin Bode Plot Semi-Log Paper on Pinterest (opens in a new tab)Free Bode plot semi-log paper with two stacked graphs on one page: Magnitude (dB) on top and Phase (degrees) below, sharing a 5-decade logarithmic frequency axis. The vertical scales are linear, ruled every 1/10 inch, so you set your own dB and degree steps. Made for circuits, filters and control systems courses.
Downloads by color
-
Black
Download PDF (US Letter, Black) (opens in a new tab)Not available in this combination. The closest versions:
-
Blue
Download PDF (US Letter, Blue) (opens in a new tab)Not available in this combination. The closest versions:
-
Red
Download PDF (US Letter, Red) (opens in a new tab)Not available in this combination. The closest versions:
-
Green
Download PDF (US Letter, Green) (opens in a new tab)Not available in this combination. The closest versions:
Free for home, classroom and work use. License information