Liquid Limit Semi-Log Graph
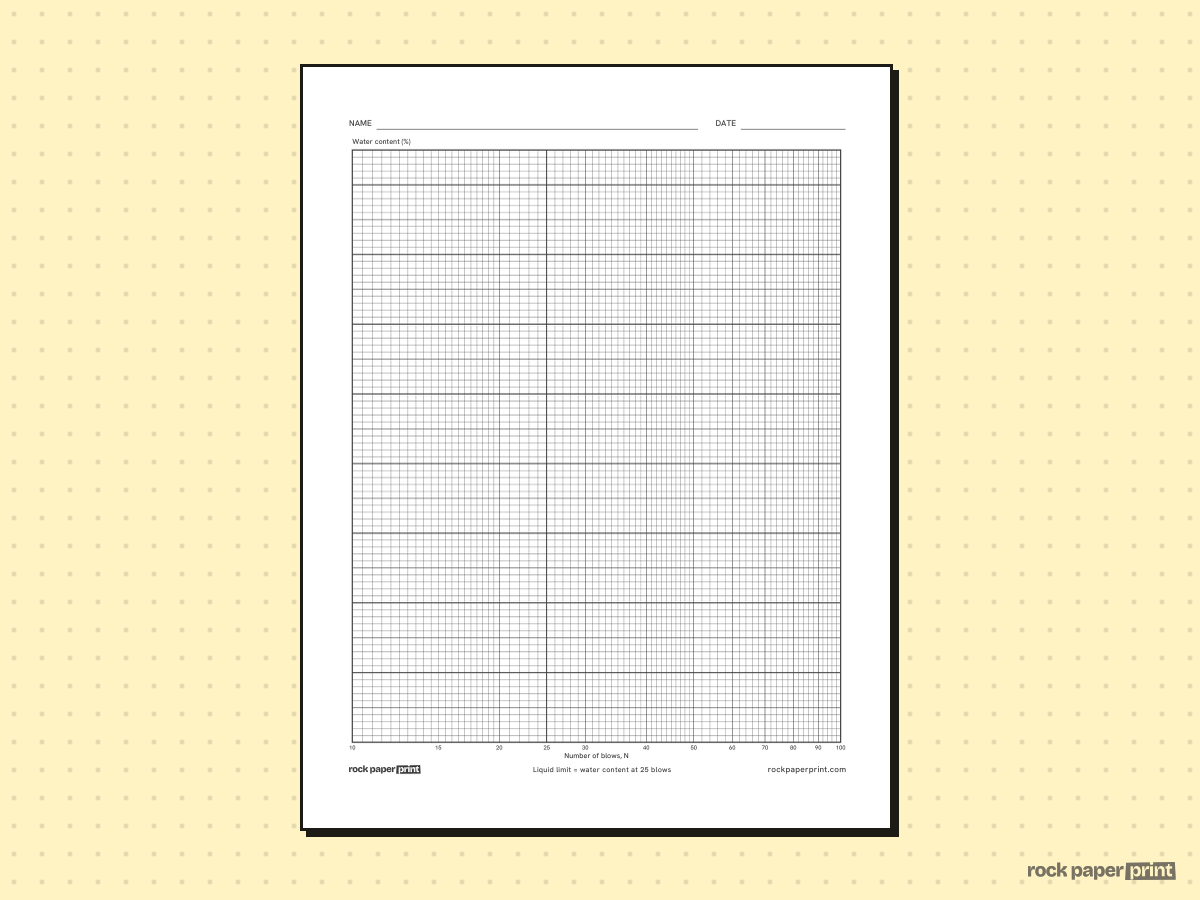
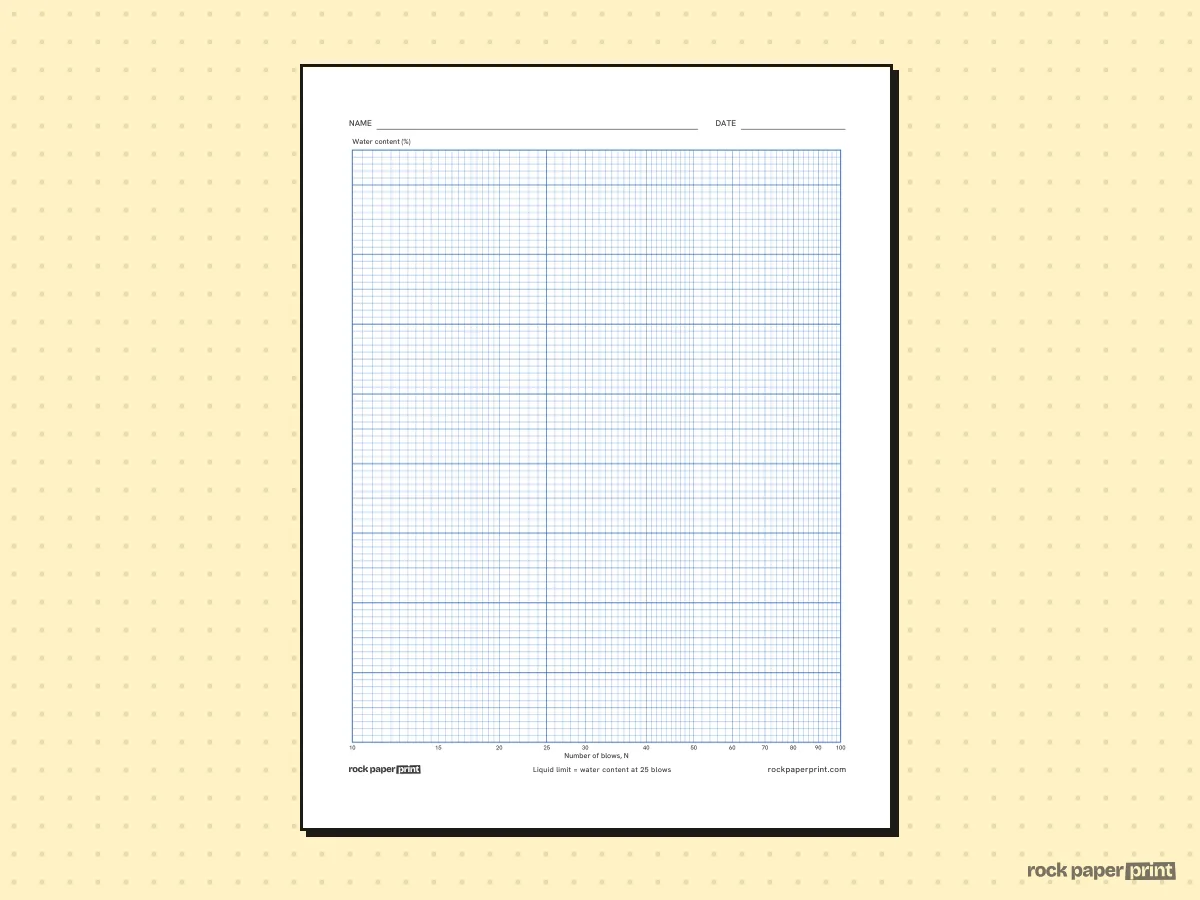
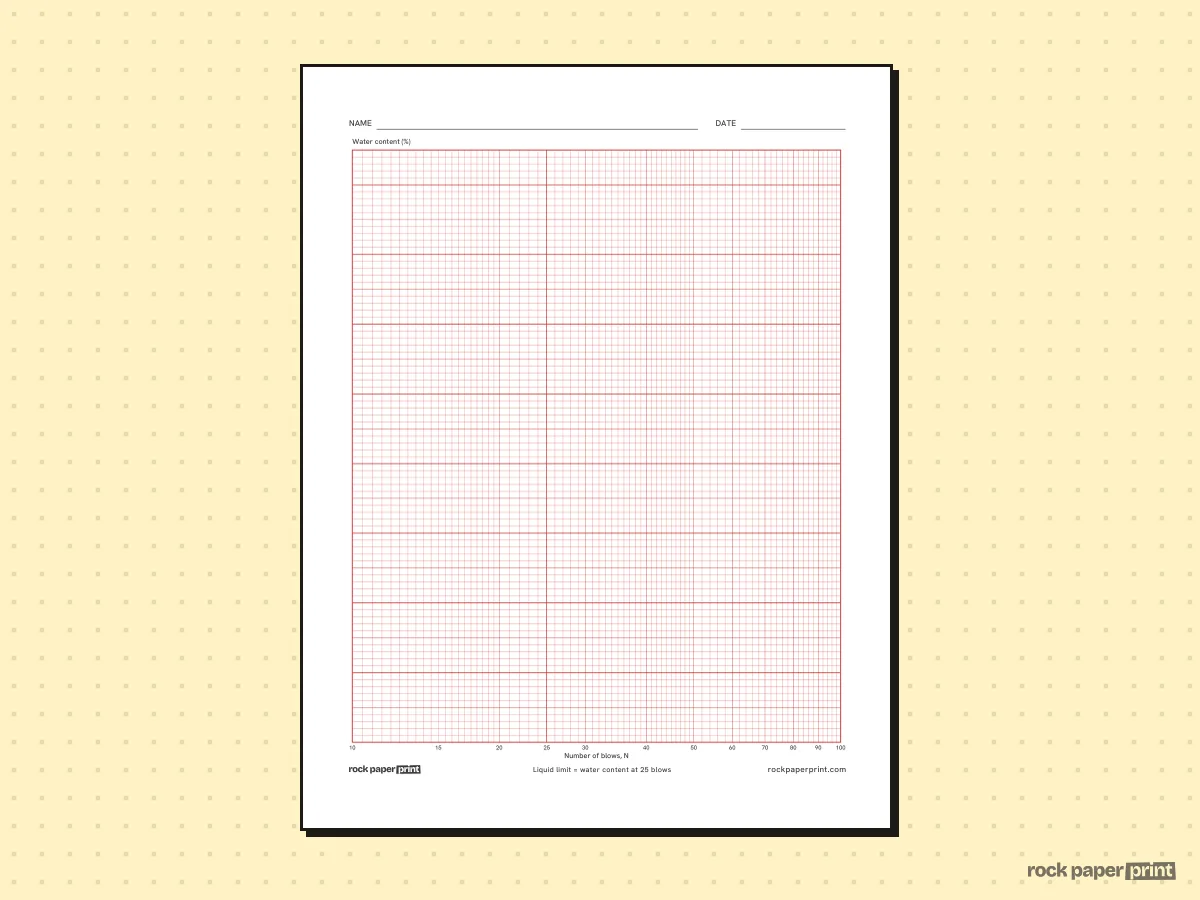
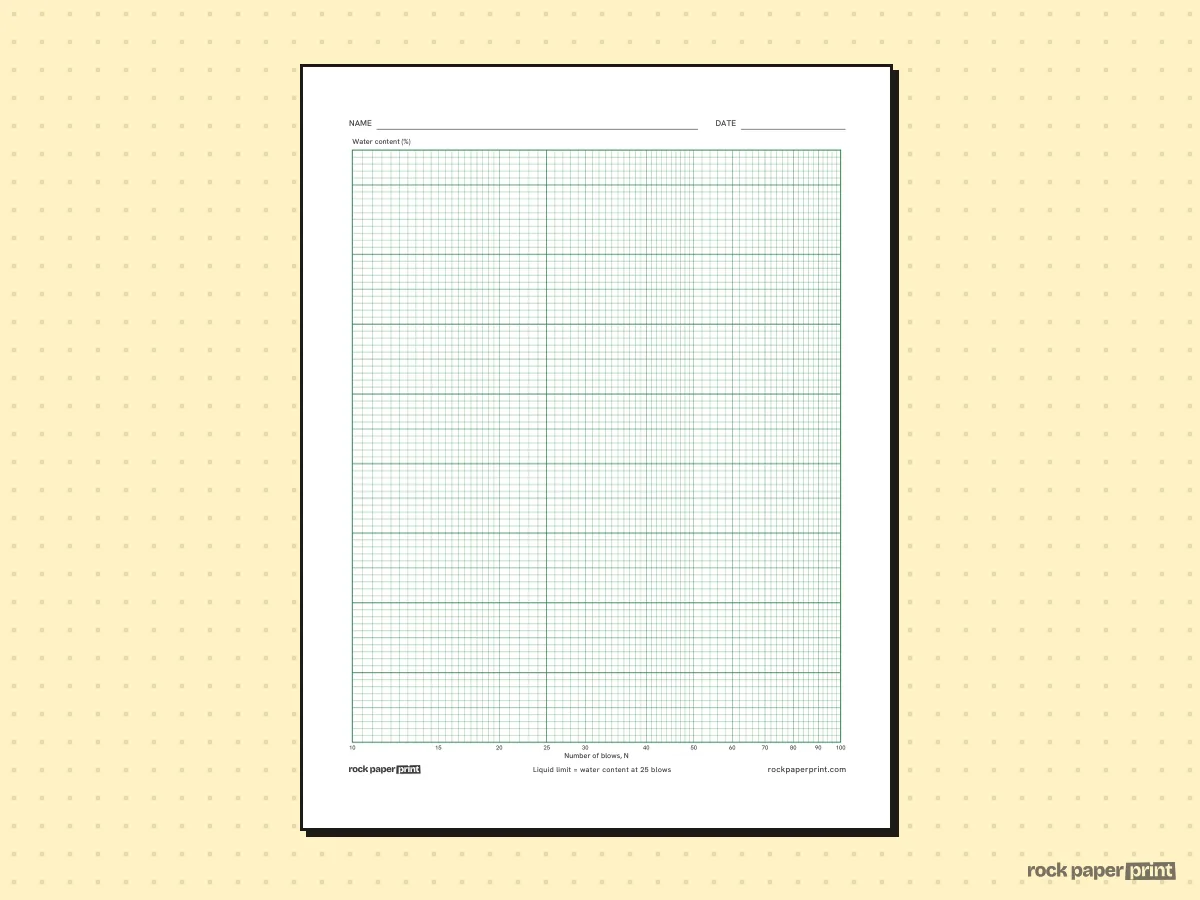
Pin Liquid Limit Semi-Log Graph on Pinterest (opens in a new tab)A free liquid limit semi-log graph for the Casagrande cup test: number of blows from 10 to 100 on a log scale across the bottom, and water content (%) on a linear scale up the side. The 25-blow line is drawn heavier, since the liquid limit is the water content where the flow curve crosses it.
Downloads by color
-
Black
Download PDF (US Letter, Black) (opens in a new tab)Not available in this combination. The closest versions:
-
Blue
Download PDF (US Letter, Blue) (opens in a new tab)Not available in this combination. The closest versions:
-
Red
Download PDF (US Letter, Red) (opens in a new tab)Not available in this combination. The closest versions:
-
Green
Download PDF (US Letter, Green) (opens in a new tab)Not available in this combination. The closest versions:
Free for home, classroom and work use. License information